


In August 2024 Google has launched a new option to report over Ad Manager data called Interactive reports. It is dynamic and user-friendly data presentation tools.
Why is it important to GAM users and Yield Managers?
It allows you to engage with the data in real-time. Unlike static reports, which only present fixed data snapshots, interactive reports enable users to manipulate the data, explore different views, and derive insights on the fly.
Have you experienced reporting in Google Adsense? Honestly speaking, it was far more convenient to get a quick insight over what has happened recently or in selected time period also involving line or pie chart. If you wished to achive similar experience in GAM, you needed to connect Looker studio, which is exclusive 360 feature.
GAM SB users so far relied only on table or hierarchic view which spit data based on selected dimensions and added preferred metrics.
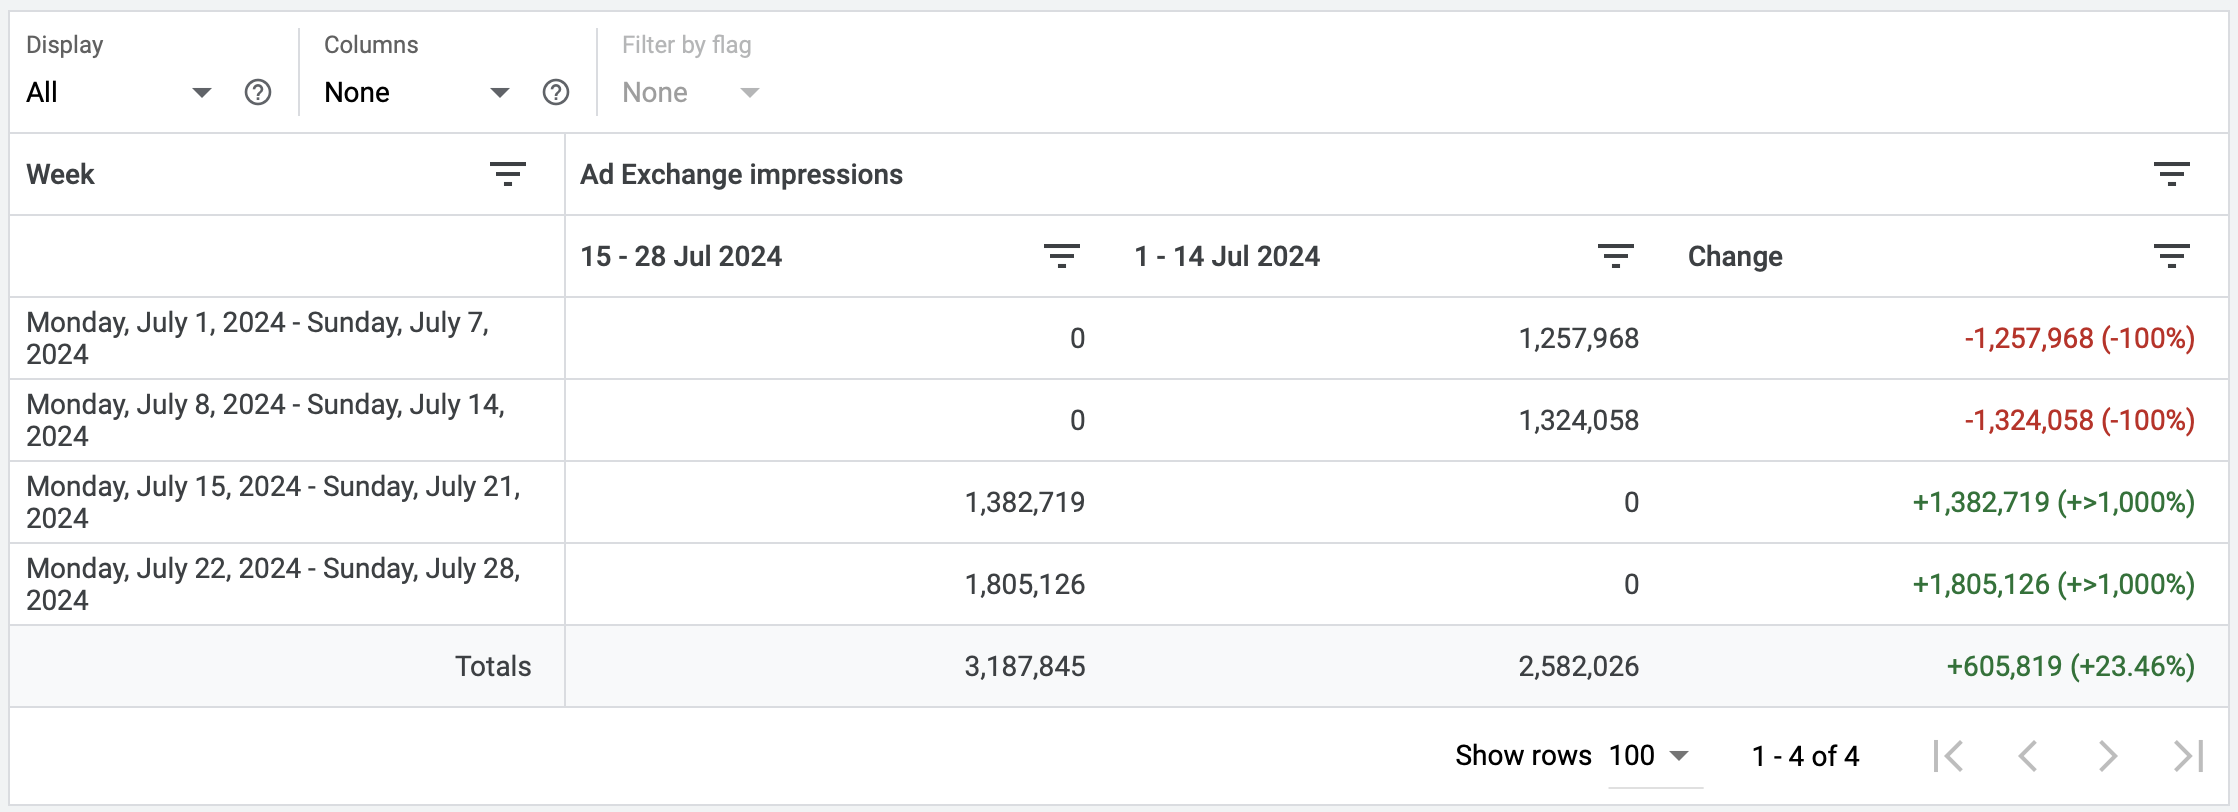
The most important benefit of Google Ad Managers Interactive reports is the ability to add compare period.
Why is compare period a powerful feature?
It allows you to analyze trends outside the chart and see how your data for:
- Progress Tracking: Comparing current performance against a previous period allows for assessing whether strategic initiatives or changes have had the desired effect.
- Benchmarking: It provides a benchmark to evaluate the success of recent actions or initiatives.
Google Ad Manager launched Beta of it's interactive reports, see the official documentation.